Money bag distribution map: The richest area in the mainland is the poorest state in the United States, and the income in the north is less than half of that in London! The polarization between rich and poor may be more serious than you think.
This article first appeared on the WeChat public account: Zhigu Trend. The content of the article belongs to the author's personal opinion and does not represent the position of Hexun.com. Investors should act accordingly, at their own risk.
In Shanghai, drinking a Starbucks at work is not a luxury for many white-collar workers. However, along the Yangtze River all the way to the mainland, a day a cup of Starbucks is getting farther and farther.
In a country, the differences between the richest and poorest regions are often beyond imagination, even in many developed countries.
Germany, which works on average in the richest states for more than four months, can earn the income of the poorest state for a year.
In China, working in the richest provinces for an average of three months, you can get the income of the poorest province for one year.
In Thailand, this time was shortened to half a month.
In the traditional impression, the rich land of the United States is concentrated on the east and west coasts. Where is the poorest place?
Britain, Australia, Japan, Canada, France, etc. What are the distributions of the rich and the poor in the region, and what are the characteristics behind them?
Today, we use data to visualize the distribution of rich and poor regions in the countries most concerned by the Chinese. If you choose to invest or immigrate to study, you can quickly know the situation in your area.
The analysis is based on provincial administrative divisions. Below are the ratios of the richest and poorest provinces in the world.
|
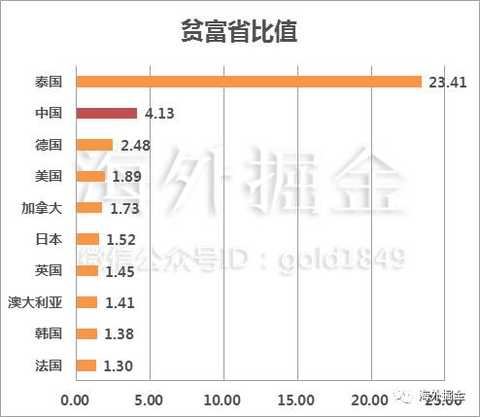
(Because of the different statistics of countries, the data used for the ratio includes the per capita income, household income, and per capita GDP. The data comes from national statistical offices, the French data is 2013 data, and the South Korea is 2014. The same below.)
It can be seen that the regional gap in developing countries is larger than in developed countries. Thailand is the most obvious. The gap between the rich and the poor in China is still relatively serious, and the difference between the first and last is more than four times.
The gap between developed countries is small, but there are also differences. If you reduce the per capita income of the richest provinces in the poorest provinces, the absolute difference can be divided into three categories:
Developed countries with large regional disparities: Germany, Canada, and the United States (poor and poor between 200,000 and 250,000 yuan)
Regional differences in moderately developed countries: Australia, Japan (poor and poor 50,000-100,000 yuan)
Developed countries with small regional gaps: Britain, France, South Korea (less than 50,000 RMB)
|
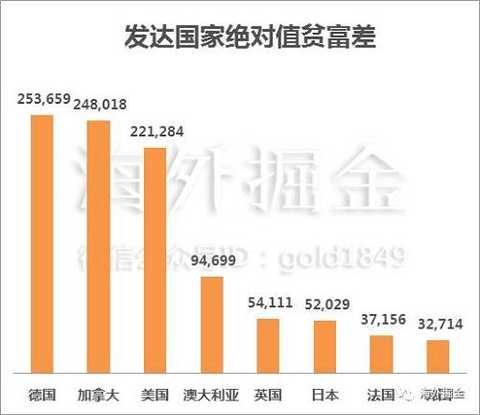
(Because there are some differences in the statistical standards of countries, here is only a rough comparison, detailed to specific countries to do specific analysis)
In the figure below, red is a high-income area and blue is a low-income area.
01
Germany: East Germany, South Germany, West Germany
|

(2015 Germany income distribution map, data source: German Statistical Office, cartography: Xiaowu)
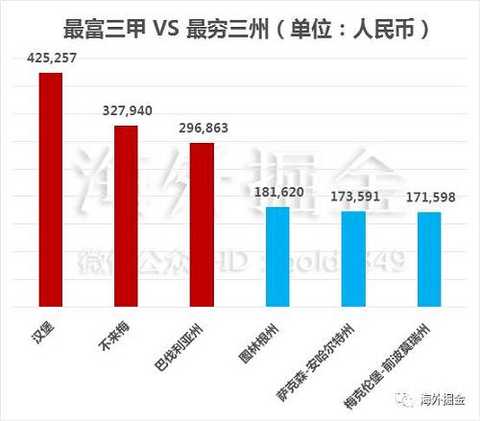
The difference in income in Germany should be the largest in Western Europe. The highest state-level city burger and the lowest state have an absolute wage difference of 2.48 times.
In South Germany, the general income is more than 290,000 RMB/year (the average income in Germany is 250,000 RMB/year). The southern part of Stuttgart has Germany's most advanced precision manufacturing industry, including BMW Benz's large enterprises, and rising. The IT industry, these are all for the South Della.
Berlin's income is better in East Germany, but it is also below the national level in Germany. Judging from the current development of the German economy, the development of Berlin as the capital still has great potential.
|
(Cartography: Small Five)
02
Canada: Not the closer the US is to the richer
|

(2015 Canada's income distribution map, data source: Statistics Canada, the same below, drawing: small five)
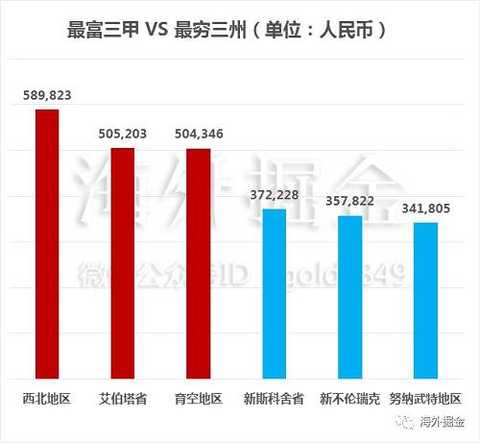
Between Canada's richest and poorest regions (yearly family income), the average income of ordinary families in a first-tier city in China is worse.
Surprisingly, Canada's wealthiest region is not Ontario or Quebec, nor is it more family income than the traditionally developed provinces of the United States, but the northerly areas of Yukon, Northwest and Alberta.
The two highest-income areas are mainly concentrated in Canada, which is sparsely populated and rich in minerals. After this comparison, the income is raised.
|
(Cartography: Small Five)
03
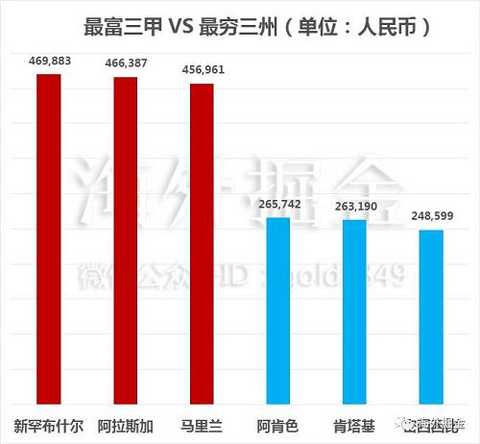
United States: East and West shore star states have obvious advantages
|

(2015 US income distribution map, data source: US Bureau of Statistics, the same below, drawing: small five)
The income of households in the richest and poorest states in the United States differs by 1.89 times. Similar to our imagination, when Obama was still the president of the United States, the income of the family in the traditional energy-producing states of the United States was relatively low, such as Wyoming and West Virginia.
Protestants first landed in traditional states, such as the northeastern states of Virginia, Massachusetts, and Connecticut, as well as the more technologically advanced states such as Washington and California, which have higher per capita income.
The southeastern United States is the region with the lowest per capita income, which is related to the impact of hurricanes and agriculture as a major local industry.
|
(Cartography: Small Five)
04
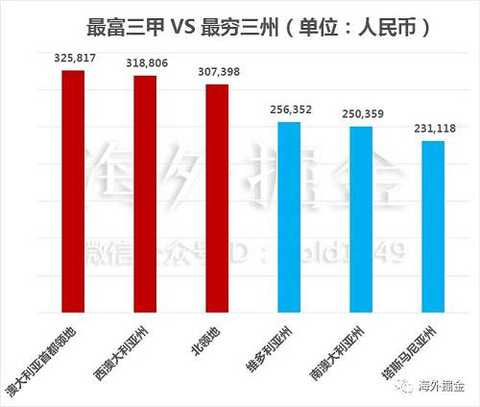
Australia: I didn't expect Western Australia to be so rich.
|

(Analysis of per capita income distribution in various regions of Australia in 2015, data source: Australian Bureau of Statistics, the same below, cartography: P5)
The per capita wages in Australia are much richer and poorer than the countries mentioned above, about 1.41 times. The Capital Territory is the region with the highest per capita income in Australia, thanks to its small size and excellent resources.
Also, like Canada, it is not the state with the largest cities such as Sydney, Melbourne or Brisbane that is the highest-paid state, such as New South Wales (but not low, above the Australian average), but Western Australia. State.
I consulted some friends in Australia. Although the wage gap between Australian and Australian jobs is not large, the reason why Western Australia's wages are higher than the east is because of its rich mineral resources and sparse population. “The average annual salary is almost 50,000 Australian dollars.â€
|
(Cartography: Small Five)
05
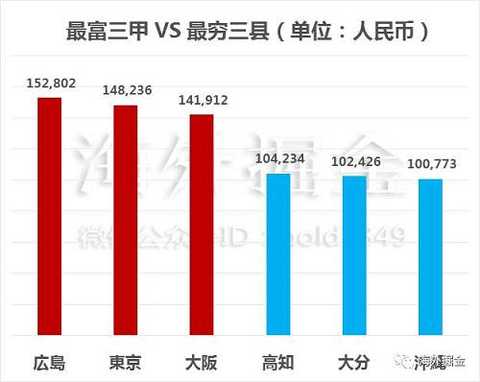
Japan: The Northeast is not as poor as you think, and the Kinki area (Kyoto, Nara, etc.) is not as rich as you think.
|

(Japan's income distribution map in 2015, data source: Ministry of Health, Labour and Welfare, the same below, cartography: Xiaowu)
Since Japan, the gap between the richest counties and the poorest has been reduced to 1.52 times. As a country with 47 prefectures, it has shrunk a lot.
When I saw the data from Japan, I was amazed. First, the actual per capita income in the Northeast is actually not as bad as imagined.
When discussing the northeastern regions of Japan (Aomori Prefecture, Akita Prefecture, Iwate Prefecture, Yamagata Prefecture, Miyagi Prefecture, and Fukushima Prefecture), because of agriculture, it often gives the impression of rural, backward, and undeveloped. However, this does not mean that they are not rich. The per capita income of Miyagi West County in the northeast region reached 138,000 RMB/year, ranking the fifth in the country. In Akita County, the lowest income county, there are also people with an income of RMB 107,000/year.
In addition, although it is an ancient city, but it does not show the level of affluence, Kyoto's per capita income is about 115,000 yuan / year, ranking the country countdown. However, this may be related to the fact that it relies mainly on tourism and does not have too much development and industrial presence.
|
(Cartography: Small Five)
06
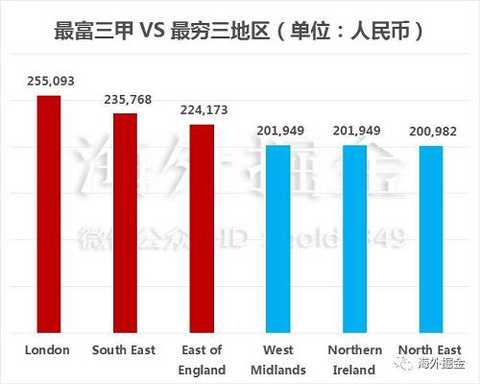
Britain: As imagined, London is the richest, Northern Ireland is the poorest in the Federation.
|
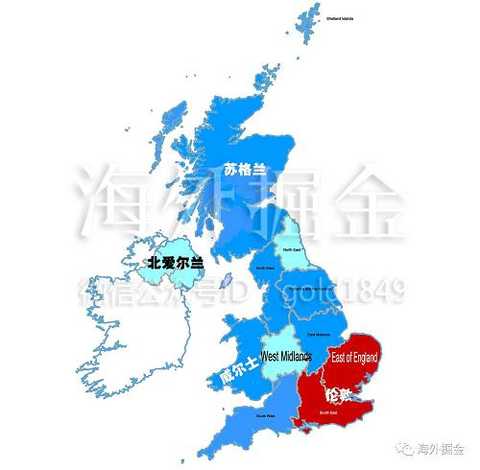
(Analysis of per capita annual income distribution in various regions of the UK in 2015, data source: UK government, the same below, cartography: P5)
From a regional perspective, the richest is still in London and its surrounding areas, the per capita annual income gap is about 1.45 times. The poorest is the Northeast. In terms of counties, the difference in income is up to 86,000 (the counties in Scotland, Northern Ireland, and Wales are not counted); in the region, it is 54,000.
In terms of the average income of the federal states, England > Scotland > Wales > Northern Ireland.
|
(Cartography: Small Five)
07
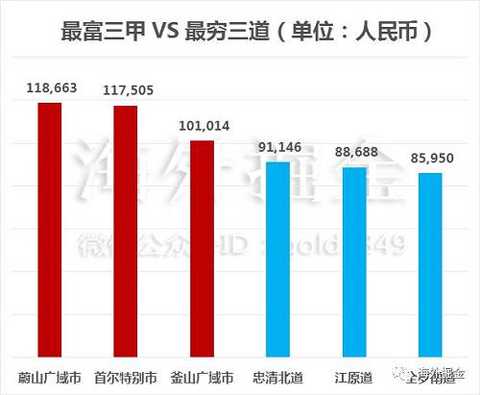
South Korea: A big business can pull a city's GDP
|

(2014 South Korean per capita income distribution map, data source: Korea Statistics Bureau, the same below, drawing: Xiaowu)
South Korea is a country with a richer country, and the gap between the poorest and richest cities/roads is 1.38 times. However, this country is very special. It will be found that the per capita GDP of each region in 2014 will be found in only three regions above the national average, namely Ulsan City, Seoul City and Busan City. The rest are below the average.
South Korea’s economic development is inseparable from the blessing of “Korean Lightâ€. The first city in Ulsan is the base of Hyundai Motor, and the second Seoul is the home of Samsung, the world's mobile phone. Busan has the reputation of South Korea, Hong Kong, the financial center of Korea, and the largest port in Korea and the largest shipbuilding industry.
The accumulation of resources is very obvious in South Korea, and these three cities have almost monopolized the most important industries in Korea.
|
(Cartography: Small Five)
08
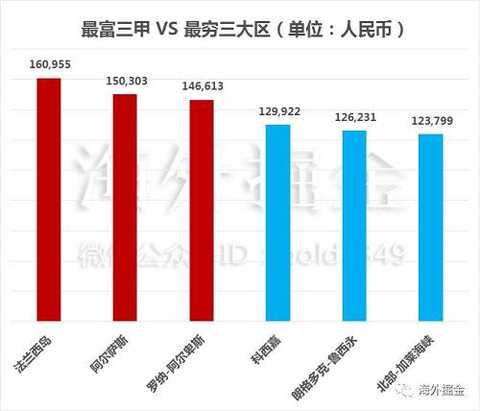
France: The country where the capital of romance is not centered on tourism
|

(2013 French per capita income distribution map, data source: French Economic Statistics Institute, the same below, drawing: Xiaowu)
The geographical difference in per capita income in France is also very small, with a difference of 1.3 times between the highest and the lowest. You can be said to have achieved good results in this country. Even friends have a joke. This is a true socialism.
When it comes to France, the first thing that comes to mind is definitely the Paris, the capital of romantic fantasy, and the famous tourist destinations such as Lavender's famous Provence. However, France does not rely on these tourist attractions. On the contrary, the urban development of tourist attractions alone is relatively weak here.
|
(Cartography: Small Five)
09
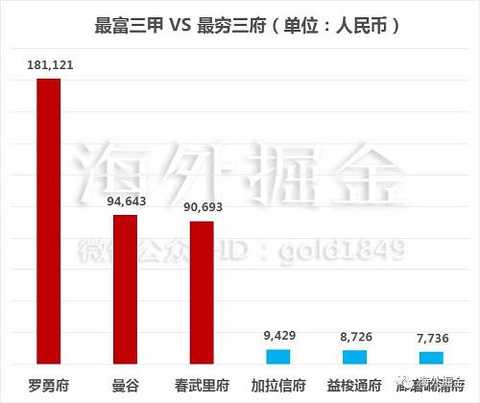
Thailand: Developed regions are closely related to tourism
|

(2015 Thailand income distribution map, data source: Statistics Bureau of Thailand, the same below, drawing: Xiaowu)
Thailand is the country with the largest gap between the rich and the poor among the ten countries we are looking for. Although the absolute value gap is no less than that of the developed countries with uneven income (about 173,000 yuan), it is the largest (23 times).
Unlike France, tourism is one of Thailand's most important sources of income. It is not difficult to see from the map that several Thai cities that Chinese people like to travel to, such as Chiang Mai, Bangkok, Phuket, Dacheng, etc., are more developed areas in Thailand.
On the contrary, the GDP of the neighboring country borders and the eastern part of Thailand (the neighboring Laos and Cambodia) is not high.
In 2012, more than half of Thailand's industry is on the shoulders of the service industry. The service industry, including the catering, retail, tourism and hospitality industries, is an important financial source for Thailand.
|
(Cartography: Small Five)
10
China: Echelon division is obvious, coastal wealthy inland poor
|

(2015 China's per capita GDP distribution map; data source: China National Bureau of Statistics, World Bank, the same below, cartography: Xiaowu)
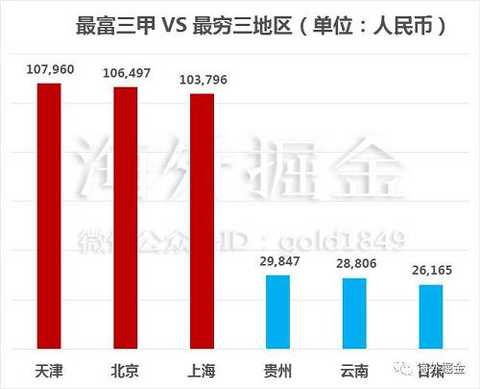
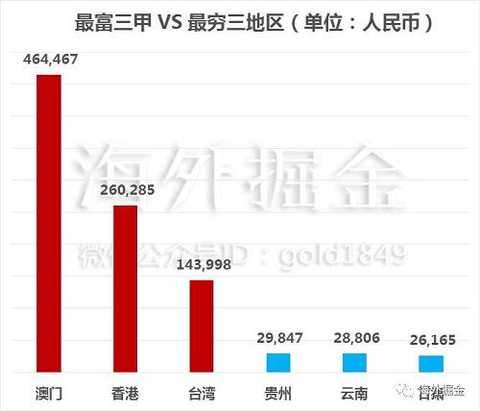
Finally, we must open up the most important difference between China’s rich and poor. Looking at China as a whole, the richest province is Taiwan Province (per capita GDP is 144,000 yuan/year), and the city with the highest income is Macau (per capita GDP is 464,000 yuan/year). If Hong Kong, Macao and Taiwan are not included, the highest level of provincial and above in mainland China is Tianjin.
As many people think, the wealthy areas of 31 provinces and municipalities are mainly concentrated on the southeast coast. The municipalities directly under the central government, Tianjin, Shanghai and Beijing accounted for the top three, belonging to the first echelon in China. Coastal + Inner Mongolia is the second echelon.
The provinces with fewer populations in the Northeast and the Mainland (such as Shaanxi, Hubei, and Ningxia are the regions where China's average level is located.
It is worth mentioning that we found in the data that Guangdong's per capita GDP ranks 8th, not higher than Fujian. Although it has two major first-tier cities in Shenzhen and Guangzhou, the overall average has been pulled down because of the large gap in development within the region.
|
(Excluding Hong Kong, Macao and Taiwan, drawing: Xiaowu)
|
(including Hong Kong, Macao and Taiwan, drawing: Xiaowu)
11
It is still a long way to go to reach the balance of China.
Several characteristics can be seen from the distribution of incomes in countries. First, the most famous areas in many countries are not necessarily the highest income. Australia and Canada are two "exciting", and the most affluent areas are places where there are fewer natural resources. The country’s attributes affect the country’s income distribution.
Another feature is related to the industry. Thailand, which is still in the middle stage of development, still relies heavily on the capital that tourism brings to the region, and the economy in developed tourism regions is also more developed. Of course, it can be said that the tourism equipment in the developed areas is also more perfect, which has led to the local tourism industry.
But in France, which is also a big tourist country, tourism is not its main industry. Most developed regions are finance, service, science and technology, and industrially developed regions. For example, the Rhône-Alpes region where Lyon is located is known for its diverse industrial development, with Schneider Electric, commercial textiles and IT. The same situation exists in Japan.
When it comes to the IT industry, it has to say that the industry is so powerful. As the star of today + the future, it can make the region the richest region in the world. This is true of China's Guangdong Province, South Korea's Seoul, France and Germany.
Returning to the discussion of income, the absolute value of domestic per capita income cannot be comparable to that of developed countries. Of course, purchasing power will subdivide absolute income. Except for Hong Kong, Macao and Taiwan, the highest Tianjin is only 108,000 RMB/year, which is equivalent to the average income level of Akita Prefecture in Japan. It is 1/2 of London's, and the absolute value of the last US income is also the first in mainland China. One is taller than one.
In recent years, there have been discussions that China is approaching the level of wealth in the middle-developed countries, that is, the per capita GDP is between 10,000 and 37,000 US dollars. China's per capita is 8,000+ US dollars, and some regions have reached the level of moderate development.
But Gansu, which looks back at the lowest income, is only $4,200, and more than half of the cities are below the level. This road to wealthy wealthy people still has a long way to go.
Fleece Fabric,Cardinal Fleece Fabric,Fleece Knit Fabric,Custom Fleece Fabric
SHAOXING KAIMING TEXTILES CO.,LTD , https://www.kaimingtextiles.com